Vitali Kremez
  • Home
  • About
  • Contact
  • Cyber Security
  • Cyber Intel
  • Programming
  • Reverse Engineering
  • Exploit Development
  • Penetration Test
  • WIN32 Assembly
  • On Writing
    • Blog
    • LSAT
    • Photo
  • Honeypot
  • Forum

ZeroAccess: int 2d Anti-Debugging

5/17/2016

0 Comments

 
Source: fumalwareanalysis.blogspot.com

Learning Goals: 
  1. Understand the general interrupt handling  mechanism on X86 platform.
  2. Understand the byte scission anti-debugging technique.
  3. Know how to use a binary debugger to patch an executable program.

The general anti-debugging techniques are as follows:

(1) to detect the existence of a debugger, and behave differently when a debugger is attached to the current process; and,
(2) to disrupt or crash a debugger.

 The instruction we are trying to analyze is the "INT 2D" instruction located at 0x00413BD5 (as shown in Figure 1). By single-stepping the malware, you might notice that the program's entry point is 0x00413BC8. After the execution of the first 8 instructions, right before the "INT 2D" instruction, 
the value of EAX is 0x1. This is an important fact you should remember in the later analysis.
Picture
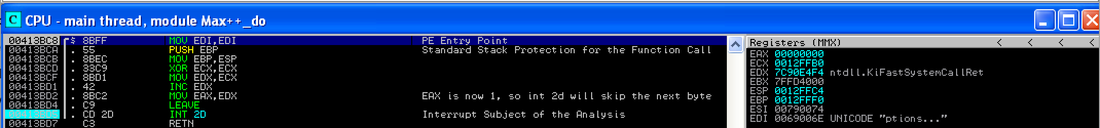
 Now let us watch the behavior of the Immunity Debugger (IMM).   By stepping over (using F8) the instruction "INT 2D" at 0x413BD5,  we are supposed to stop at the next immediate instruction "RETN" (0x00413BD7), however, it is not. The new EIP value (i.e., the location of the next instruction to be executed is 0x00413A38)! Now the big question: is the behavior of the IMM debugger correct (i.e., is it exactly the same as the normal execution of Max++ without debugger attached)?

 When a program uses instructions like "int 2d" - it's an exception and triggers a whole procedure of interrupt handling. It is beneficial to completely understand the technical details involved in the interrupt handling scenario. We recommend the Intel IA32 Manual [
5] (ch6: interrupt and exception overview). Some important facts are listed below:
  1. Interrupts happen due to hardware signals (e.g., I/O completion signals, and by executing INT xx instructions). They happen at random time (e.g., I/O signal), except the direct call of INT instructions.
  2. Exceptions occurs when CPU detects error when executing an instruction.
  3. When an interrupt/exception occurs, normal execution is interrupted and CPU jumps to the interrupt handler (a piece of code that handles the interrupt/exception). When interrupt handler completes, the normal execution resumes. Interrupt handlers are loaded by OS during system booting, and there is an interrupt vector table (also called interrupt descriptor table IDT) which defines which handler deals with which interrupt.
  4. In general there are following interrupts/exceptions: (1) software generated exceptions (INT 3 and other INT n instructions - note the discussion of "not pushing error code into stack" for INT n instructions), (2) machine checking interrupts (not interesting to us at this point), (3) fault - an exception that can be corrected, when the execution resumes, it executes the same instructions (which triggers the exception) again, (4) trap - different from fault in that when resuming, it resumes from the next immediate instruction (to be executed), (5) abort (severe errors, not interesting to us at this point). If you look at Table 6-1, the divide by 0 exception and protection error are fault, and the INT 3 (software breakpoint) is a trap. Section 6.6 gives you a clear idea of the difference between fault and trap.
  5. When an interrupt/exception happens, the CPU pushes the following information (varies depending on the type of interrupt/exception): EIP, CS and flag registers, and ERROR CODE into the stack. Then find out the entry address of the interrupt handler using IDT, and jumps to it. Note that the saved EIP/CS (return address) depends on if it is a fault and trap! Then the interrupt handler will take over the job, and when resuming, use the information of the saved EIP/CS.
INT 2d is the interface for Win32 kernel to provide kernel debugging services to user level debuggers and remote debuggers such as IMM, Kd and WinDbg. User level debuggers invoke the service usually by

 NTSTATUS DebugService(UCHAR ServiceClass, PVOID arg1, PVOID arg2)

According to  [7], there are four classes (1: Debug printing, 2: interactive prompt, 3: load image, 4: unload image). The call of DebugService is essentially translated to the following machine code:

  EAX <- ServiceClass
  ECX <- Arg1
  EDX <- Arg2
  INT 2d

The interrupt triggers CPU to jump to KiDispatchException, which later calls KdpTrap (when the DEBUG mode of the windows ini file is on, when Windows XP boots). KdpTrap takes an EXCEPTION_RECORD constructed by KiDispatchException. The EXCEPTION_RECORD contains the following information: ExceptionCode:BREAKPOINT, arg0: EAX, arg1: ECX, and arg2: EDX. Note that according to [7] (Section "Notifying Debugging Events"), the INT 3 interrupts (software breakpoints) is also handled by KdpTrap except that arg0 is 0.

Notice that KiDispatchException deserves some special attention. Nebbett in his book [9] (pp. 439 - sometimes you can view sample chapters from Google books) lists the implementation code of KiDispatchException (in Example C.1). You have to read the code in [9] and there are several interesting points. First, let's concentrate on the case if the previous mode of the program is kernel mode (i.e., it's the kernel code which invokes the interrupt):
  1. At line 4 of the function body, KiDispatchException reduces EIP by 1, if the Exception code is STATUS_BREAKPOINT (this happens when int 2dh and int 3 are invoked). Note that in , P. Ferrie gave an excellent explanation regarding why the code reduces EIP by 1!
  2. It calls KiDebugRoutine several times. KiDebugRoutine is a function pointer. It points to KdpTrap (if debug enabled set in BOOT.ini), otherwise KdpTrapStub (which does nothing). 
  3. KdpTrap/KiDebugRoutine is invoked first, and then user handler is invoked (given search frame is enabled), and then KiDebugRoutine is invoked second time if user handle did not finish the job
For the "user mode" (it's the user program which invokes int 2d):
  1. It first check if there is a user debugger not attached (by checking DEBUG_PORT). If this is the case, kernel debugging service KiDispatchException will be called first to handle the exception.
  2. Then there is a complex nested if-else statements which uses DbgkForwardException to forward the exception to user debugger. (Unfortunately, there are not sufficient documentations for these involved functions). Our guess is that DbgkForwardException is to invoke user debugger to handle exception and KiUserDipsatchException is called to search for frame based user handlers if user debugger could not handle it.
  3. If the Search Frames attribute is false, the above (1 and 2) are not tried at all. It is directly forwarded to user debugger (make it to try twice), and if not processed, terminate the user process.


"After an exception has occurred, and in the absence of a debugger, execution will resume by default at the exception address. The assumption is that the cause of the exception will have been corrected, and the faulting instruction will now succeed. In the presence of a debugger, and if the debugger consumed the exception, execution will resume at the current EIP register value."

What's more important is the following description from [3]: This should happen even before KiDispatchException is called.

"
However, when interrupt 0x2D is executed, Windows uses the current EIP register value as the exception address and increases the EIP register value by one.
Finally, it issues an EXCEPTION_BREAKPOINT (0x80000003) exception. Thus, if the ‘CD 2D’ opcode (‘INT 0x2D’ instruction) is used, the exception address points to the instruction immediately following the interrupt 0x2D instruction, as for other interrupts, and the EIP register value points to a memory location that is one byte after that.
"
According to [3], due to the above behaviors of Win32 exception handling, it could cause byte scission. When a user debugger (e.g., OllyDbg) decides to resume the execution using the EIP register value, its behavior will be different from a normal execution. 
0 Comments


Leave a Reply.

    Author

    Vitali Kremez

    Archives

    September 2016
    August 2016
    July 2016
    June 2016
    May 2016
    January 2016
    December 2015

    Categories

    All

    RSS Feed

Powered by Create your own unique website with customizable templates.
  • Home
  • About
  • Contact
  • Cyber Security
  • Cyber Intel
  • Programming
  • Reverse Engineering
  • Exploit Development
  • Penetration Test
  • WIN32 Assembly
  • On Writing
    • Blog
    • LSAT
    • Photo
  • Honeypot
  • Forum