|
Inspired by Bryan Downing's "QuantsLab HFT"
This Python iNotebook analyzes and visualizes most important U.S. economic indices using Matlab. Data Source: St.Louis Fed FRED Economic Research Here are the analyzed indices: # [1] U.S. Gross Domestic Product from 1948-2015 # [2] U.S. New Orders Nondefense Capital Goods Excluding Aircraft Index # [3] U.S. ISM Manufacturing PMI Composite Index # [4] U.S. Industrial Production Mining Index # [5] U.S. Industrial Production Business Equipment Index # [6] U.S. Continued Claims Insured Unemployment Index # [7] U.S. New Private Housing Units Authorized by Building Permits Index # [8] U.S. Industrial Production Materials Index
In [34]:
%matplotlib inline
import pandas as pd
import matplotlib
matplotlib.use("Agg")
import matplotlib.pyplot as plt
import datetime
import urllib2
import re
In [53]:
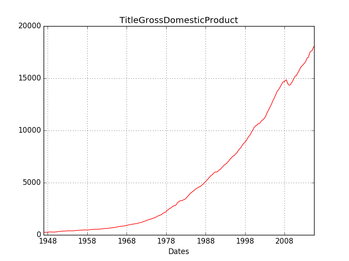
# [1] U.S. Gross Domestic Product from 1948-2015
url = 'https://research.stlouisfed.org/fred2/data/GDP.txt'
dates = []
datas = []
for x in urllib2.urlopen(url):
                        if x[:5] == 'Title':
                                title = x
                        if(x[:2] != "19" and x[:2] != "20"):
                                continue


                        mycollapsedstring = ' '.join(x.split())
                        again = mycollapsedstring.split(" ", 1)
                        dates.append(again[0])
                        datas.append(again[1])
x = [datetime.datetime.strptime(elem, '%Y-%m-%d') for elem in dates]
y = datas
plt.plot_date(x, y, fmt="r-")
plt.xlabel("Dates")
title = re.sub(r'\W+','', title)
plt.title(title)
plt.grid(True)
plt.show()

In [55]:
# [2] U.S. New Orders Nondefense Capital Goods Excluding Aircraft Index
url = 'https://research.stlouisfed.org/fred2/data/NEWORDER.txt'
dates = []
datas = []
for x in urllib2.urlopen(url):
                        if x[:5] == 'Title':
                                title = x
                        if(x[:2] != "19" and x[:2] != "20"):
                                continue


                        mycollapsedstring = ' '.join(x.split())
                        again = mycollapsedstring.split(" ", 1)
                        dates.append(again[0])
                        datas.append(again[1])
x = [datetime.datetime.strptime(elem, '%Y-%m-%d') for elem in dates]
y = datas
plt.plot_date(x, y, fmt="r-")
plt.xlabel("Dates")
title = re.sub(r'\W+','', title)
plt.title(title)
plt.grid(True)
plt.show()

In [56]:
# [3] U.S. ISM Manufacturing PMI Composite Index
url = 'https://research.stlouisfed.org/fred2/data/NAPM.txt'
dates = []
datas = []
for x in urllib2.urlopen(url):
                        if x[:5] == 'Title':
                                title = x
                        if(x[:2] != "19" and x[:2] != "20"):
                                continue


                        mycollapsedstring = ' '.join(x.split())
                        again = mycollapsedstring.split(" ", 1)
                        dates.append(again[0])
                        datas.append(again[1])
x = [datetime.datetime.strptime(elem, '%Y-%m-%d') for elem in dates]
y = datas
plt.plot_date(x, y, fmt="r-")
plt.xlabel("Dates")
title = re.sub(r'\W+','', title)
plt.title(title)
plt.grid(True)
plt.show()

In [57]:
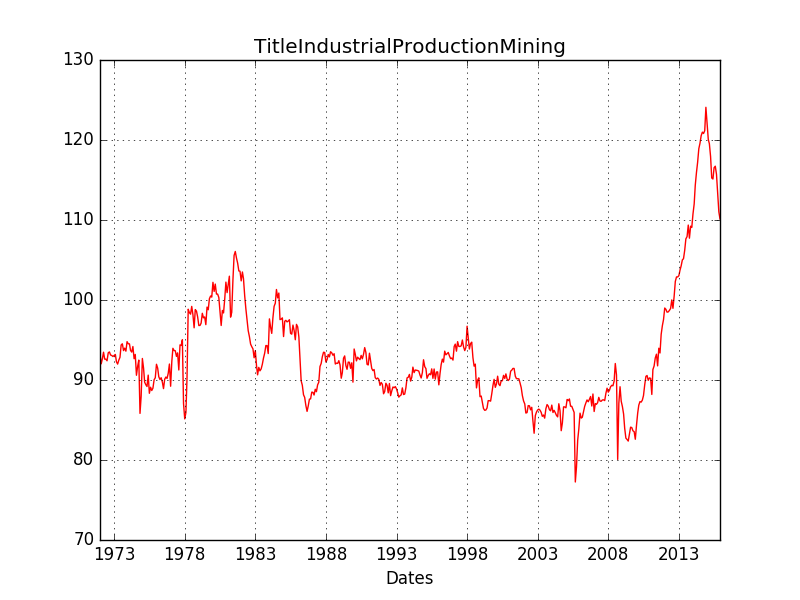
# [4] U.S. Industrial Production Mining Index
url = 'https://research.stlouisfed.org/fred2/data/IPMINE.txt'
dates = []
datas = []
for x in urllib2.urlopen(url):
                        if x[:5] == 'Title':
                                title = x
                        if(x[:2] != "19" and x[:2] != "20"):
                                continue


                        mycollapsedstring = ' '.join(x.split())
                        again = mycollapsedstring.split(" ", 1)
                        dates.append(again[0])
                        datas.append(again[1])
x = [datetime.datetime.strptime(elem, '%Y-%m-%d') for elem in dates]
y = datas
plt.plot_date(x, y, fmt="r-")
plt.xlabel("Dates")
title = re.sub(r'\W+','', title)
plt.title(title)
plt.grid(True)
plt.show()

In [58]:
# [5] U.S. Industrial Production Business Equipment Index
url = 'https://research.stlouisfed.org/fred2/data/IPBUSEQ.txt'
dates = []
datas = []
for x in urllib2.urlopen(url):
                        if x[:5] == 'Title':
                                title = x
                        if(x[:2] != "19" and x[:2] != "20"):
                                continue


                        mycollapsedstring = ' '.join(x.split())
                        again = mycollapsedstring.split(" ", 1)
                        dates.append(again[0])
                        datas.append(again[1])
x = [datetime.datetime.strptime(elem, '%Y-%m-%d') for elem in dates]
y = datas
plt.plot_date(x, y, fmt="r-")
plt.xlabel("Dates")
title = re.sub(r'\W+','', title)
plt.title(title)
plt.grid(True)
plt.show()

In [60]:
# [6] U.S. Continued Claims Insured Unemployment Index
url = 'https://research.stlouisfed.org/fred2/data/CCSA.txt'
dates = []
datas = []
for x in urllib2.urlopen(url):
                        if x[:5] == 'Title':
                                title = x
                        if(x[:2] != "19" and x[:2] != "20"):
                                continue


                        mycollapsedstring = ' '.join(x.split())
                        again = mycollapsedstring.split(" ", 1)
                        dates.append(again[0])
                        datas.append(again[1])
x = [datetime.datetime.strptime(elem, '%Y-%m-%d') for elem in dates]
y = datas
plt.plot_date(x, y, fmt="r-")
plt.xlabel("Dates")
title = re.sub(r'\W+','', title)
plt.title(title)
plt.grid(True)
plt.show()

In [62]:
# [7] U.S. New Private Housing Units Authorized by Building Permits Index
url = 'https://research.stlouisfed.org/fred2/data/PERMIT.txt'
dates = []
datas = []
for x in urllib2.urlopen(url):
                        if x[:5] == 'Title':
                                title = x
                        if(x[:2] != "19" and x[:2] != "20"):
                                continue


                        mycollapsedstring = ' '.join(x.split())
                        again = mycollapsedstring.split(" ", 1)
                        dates.append(again[0])
                        datas.append(again[1])
x = [datetime.datetime.strptime(elem, '%Y-%m-%d') for elem in dates]
y = datas
plt.plot_date(x, y, fmt="r-")
plt.xlabel("Dates")
title = re.sub(r'\W+','', title)
plt.title(title)
plt.grid(True)
plt.show()

In [63]:
# [8] U.S. Industrial Production Materials Index
url = 'https://research.stlouisfed.org/fred2/data/IPMAT.txt'
dates = []
datas = []
for x in urllib2.urlopen(url):
                        if x[:5] == 'Title':
                                title = x
                        if(x[:2] != "19" and x[:2] != "20"):
                                continue


                        mycollapsedstring = ' '.join(x.split())
                        again = mycollapsedstring.split(" ", 1)
                        dates.append(again[0])
                        datas.append(again[1])
x = [datetime.datetime.strptime(elem, '%Y-%m-%d') for elem in dates]
y = datas
plt.plot_date(x, y, fmt="r-")
plt.xlabel("Dates")
title = re.sub(r'\W+','', title)
plt.title(title)
plt.grid(True)
plt.show()

0 Comments
Leave a Reply. |
AuthorVitali Kremez Archives
January 2016
Categories |
 RSS Feed
