|
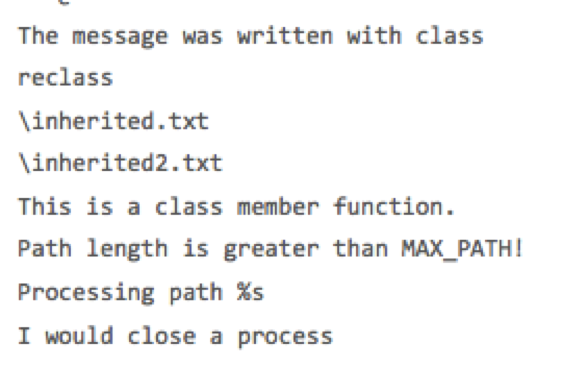
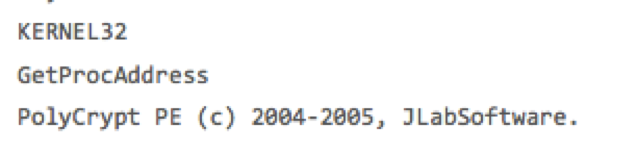
OST: "Malware Reverse Engineering" Malware Family: Dropper Static Analysis Tools: pestudio, Immunity Debugger, CFF Explorer, PEID, BinText Dynamic Analysis Tools: pexplorer, ProcMon, RegShot, ProcDump, Autoruns, Wireshark, Sandboxie Reports: (1) Malwr: https://malwr.com/analysis/Mzg2NWQ5ZDg5YmZmNGU4YTg3YzhmMWJiYjFiMjg3NTg/ (2) VirusTotal: https://www.virustotal.com/en/file/94f690dec48f9080eb0ba00e823e26a59c1b7dabe695ed954f9715afc313a730/analysis/1450185879/ I . Static Analysis: dropper.ex_ Name: dropper.ex_ File Type: PE32 executable (console) Intel 80386, for MS Windows Target machine: Intel 386 or later processors and compatible processors Compilation Timestamp: 2011-05-03 16:55:49 Entry Point: 0x0000900D Number of Sections: 6 MD5: cb905889c03593359262e25b80021dfd SHA256: 94f690dec48f9080eb0ba00e823e26a59c1b7dabe695ed954f9715afc313a730 File size: 22.5 KB (23040 bytes) Packer: Polycrypt Anti-Virus Detection Ratio: 30/55 Finding Dependencies (Imports): -KERNEL32.DLL * GetProcAddress Here are some interesting strings:
  According to Malwr's sandbox report, here are the high-entropy signs that indicate that this binary contains encrypted and/or compressed data: signs: [{u'type': u'section', u'value': {u'size_of_data': u'0x00000c00', u'virtual_address': u'0x00001000', u'entropy': 7.943119737348658, u'name': u'.text', u'virtual_size': u'0x00000ac4'}}] process: None signs: [{u'type': u'section', u'value': {u'size_of_data': u'0x00000200', u'virtual_address': u'0x00003000', u'entropy': 7.575998757201101, u'name': u'.data', u'virtual_size': u'0x0000039c'}}] process: None signs: [{u'type': u'section', u'value': {u'size_of_data': u'0x00000200', u'virtual_address': u'0x00008000', u'entropy': 7.547600613609956, u'name': u'.reloc', u'virtual_size': u'0x000001c6'}}] process: None signs: [{u'type': u'section', u'value': {u'size_of_data': u'0x00000e00', u'virtual_address': u'0x00009000', u'entropy': 7.652427949366247, u'name': u'', u'virtual_size': u'0x00001000'}}] Red Flags [pestudio]: (1) The file embeds a file (Type: Executable, MD5: 610F3CD62F75CF341B23B8C27D31FD49).  (2) The last section (name:) is executable. (3) The address of the entry point (0x0000900D) is outside the first section. (4) The file contains self-modifying code. (5) The file has no Version. (6) The file ignores cookies on the stack (GS) as mitigation technique. (7) The file is not signed with a Digital Certificate. Walkthrough: Anti-debugging tricks leverage the abnormal execution of debugged applications. Examples of such behavior are:
Unpacking Dropper.ex_: (1) Open up PEiD and drag dropper.EXE into the PEiD window. A signature has detected: PolyCrypt PE 2005.06.01 -> JLab Software 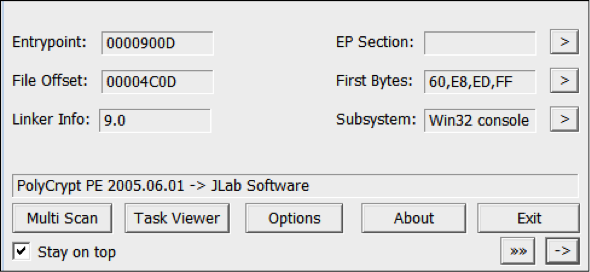 Load dropper.exe into Immunity Debugger
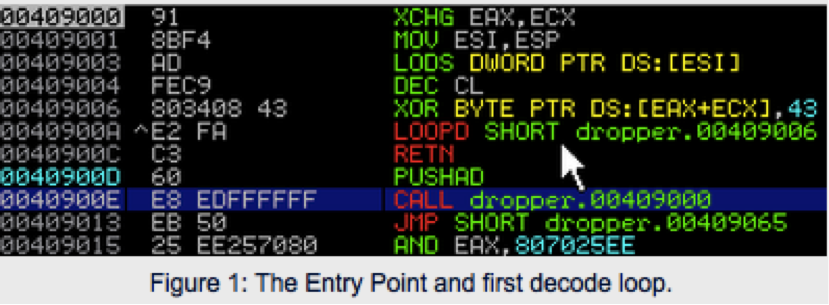 Add breakpoint (f2) at 0x0040900C Run to the break (f9) Step past ret and jmp
And we face yet another loop (ecx=0x5f7 indicates a significant decode). Run until break again. Bumps in the Road We've decode a bunch of code, but it seems we've just begun.
Exception! FS:[0] The next code segment is a bit more complex. We see:
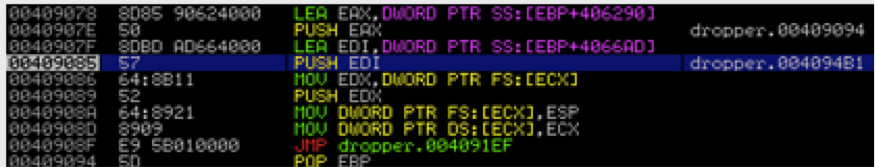 Generally, the debugger intervenes when an exception occurs. This can cause us to lose our place and have to start over Press Ctrl-G to bring up the Jump by Expression dialog
Debuggers often allow the user to break on exceptions and (debugger takes control) or pass the exception to the application. In Immunity Debugger:
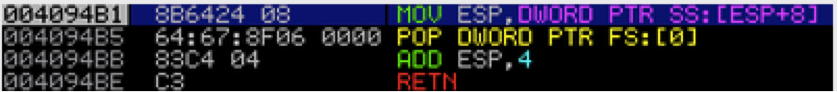
Debug Flags We are faced with another SEH trap. Once again, we can break inside the exception handler. 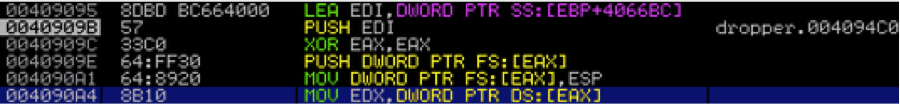 Figure 1: EAX is initialized to 0 and then dereferenced. This begins by accessing FS:[30] (the PEB), and then tests the 3rd byte (+2) to determine if it is not zero. 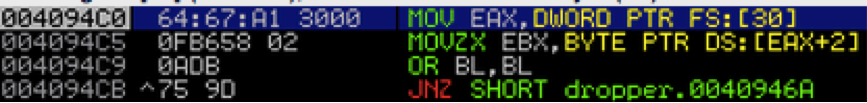 Figure 2: Inside the 2nd Exception handler the PEB.IsDebugged flag is checked. This is a common check for the PEB.IsDebugged flag. This is a common anti-debugging trick. We can use the hidedebug plugin 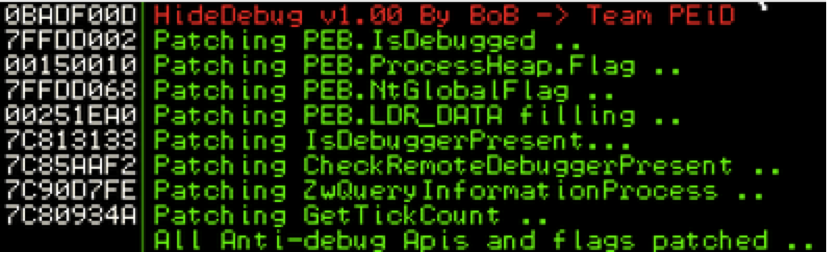 Figure 3: HideDebug patches the process memory to remove debugger artifacts. Now we can step past such blocks without a care More SEH The handler accesses a CONTEXT struct (at SS:[EBP+10]) which contains CPU state at the time the exception occurred. EIP is read into EDX and EBP is subtracted from that. The resulting value is compared with 0x004062A0 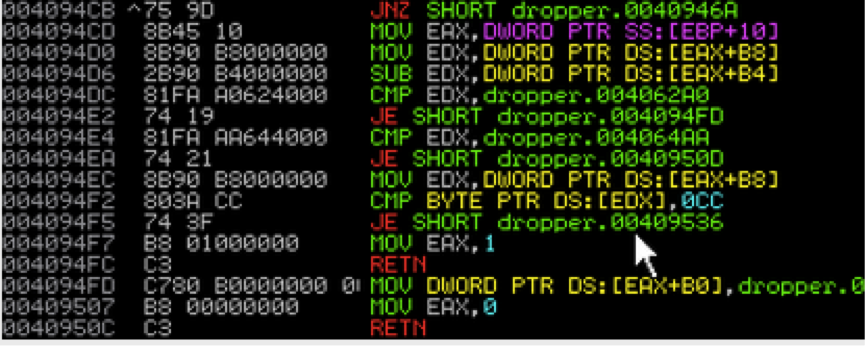 DS:[EAX+B0] receives 0x401000. Here the debugger repairs the register that caused the exception. EAX will be in 0x401000 on return from the handler. Control will return to faulting instruction A Bad Pill Malware authors may use anti-Virtual Machine techniques, although they must take into consideration their targets. If the target is a commodity home computer, it is more likely as they are less likely to be using virtual machines. Red Pill Polycrypt was created at a time when VM Detection was a hot topic. Observe the following code in dropper.EXE after the first 3 decode loops have executed: 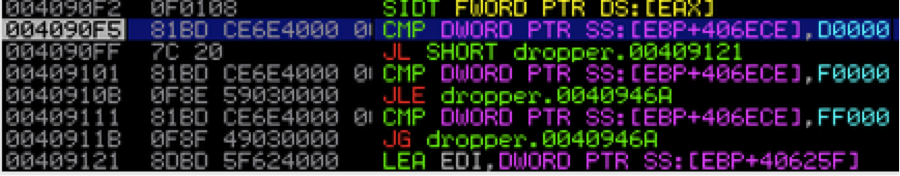 Figure 1: An sidt instruction often indicates the Red Pill VM detection technique *This is the (in)famous Red Pill reported by the invisiblethings blog years ago. It does the following:
Anti-Dump Looking ahead in the code, we see a series of push/call sequences, and the calls are made through memory locations (API calls?). 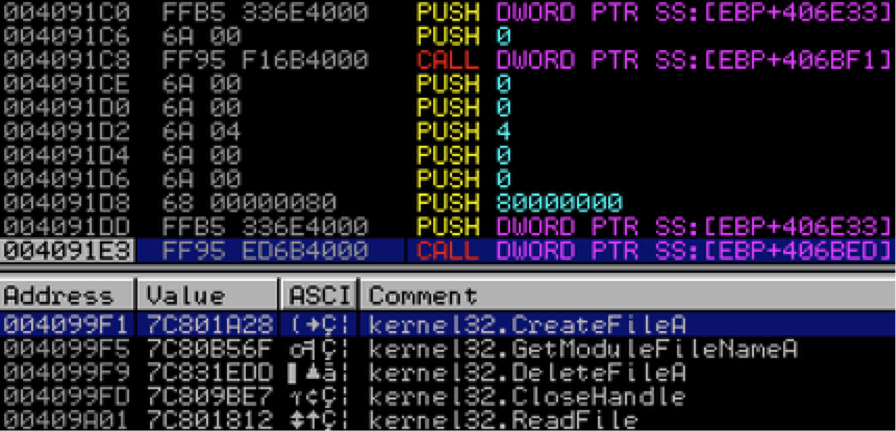 Memory DumpThe dump pane (below the assembler window) allows can help us inspect the pointers being accessed through EBP.
Analyzing the parameters The GetModuleFileNameA call pictured first takes two parameters (Remember, function arguments are pushed in reverse order):
API Hooks 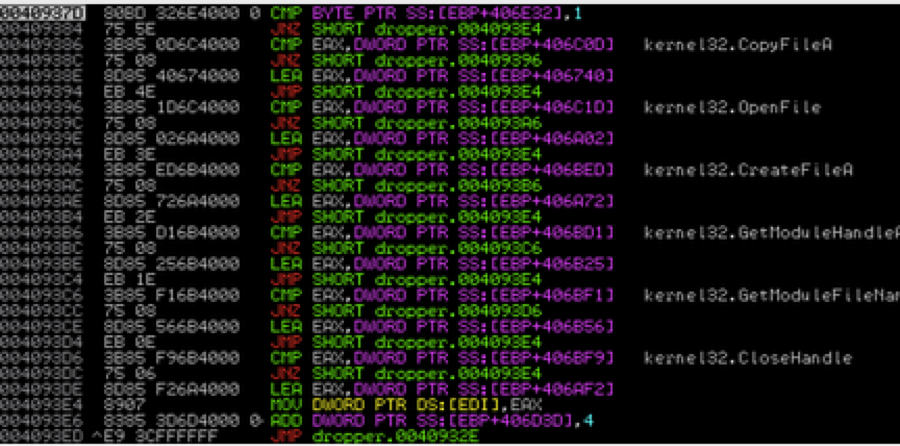 One of the unusual behaviors of this unpacker is its API Hook option. If enabled, the unpacker hooks certain API calls (e.g. CreateFileA), replacing the function points of the API calls with pointers to functions bundled with the unpacking stub. Why Hook?
A simple memory patch can be applied to integer stored at EBP + 406D35, replacing a 1 with a zero (assuming this option has been selected) Wrapping Up Unpacking can require some trial and error. We often can make educated guesses as to where transitions from unpacker code to the application to speed up the process. If we scroll through the code, we eventually encounter the following: 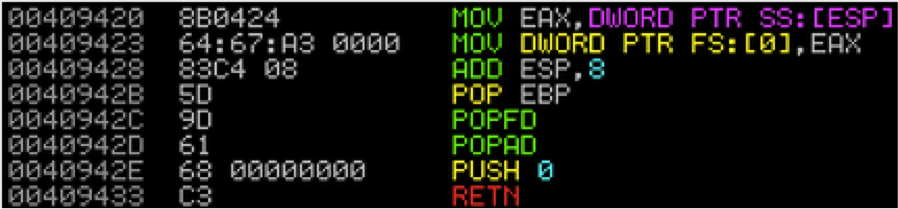 This is consistent with exit code, because it:
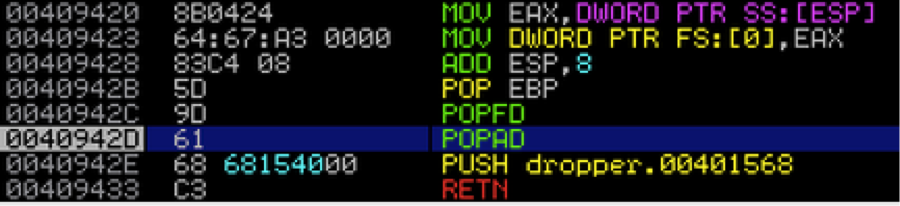 You'll notice the push instruction now has the value dropper.00401568 in place of zero Why was that so slow? If you look at the log window, you'll notice lots of messages about int3 instructions being reached. As the unpacker decrypts the application code, EIP repeatedly reaches a lot of these int3 (0xCC), which causes a brief context switch to the debugger, causing a slow down. We can risk replacing the 0xCCs with NOP (0x90) instructions (at risk if the code is used in the decryption calculations), or we can let it run its course. OEP! If we step past the return instruction, we'll find the following: 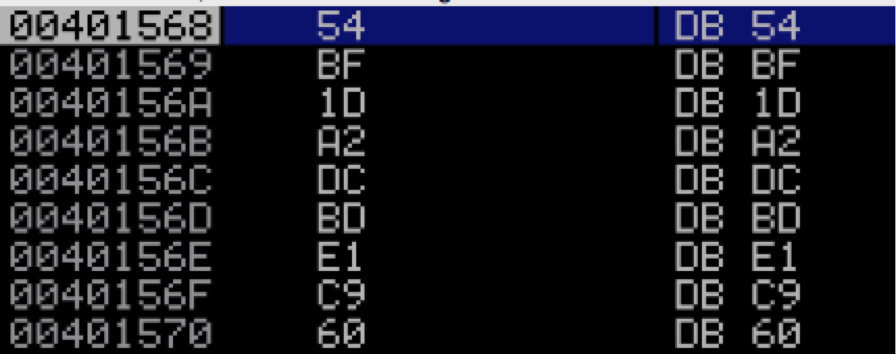 The debugger has not yet diassembled this code, so we can force this with Ctrl-A: 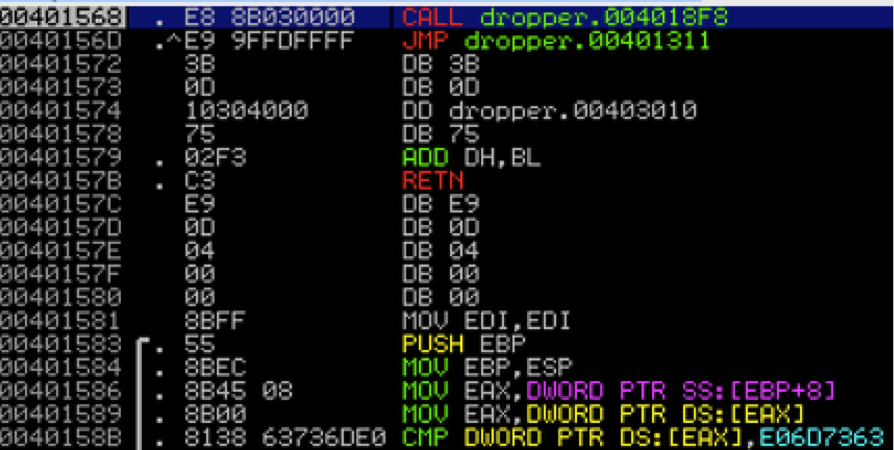 This looks good. Dump it with OllyDump, and if you're not sure, you can leave the debugger running while you take a look at things in IDA (and perhaps try to execute the dumped file).
III. Outcome: Yara Signature: rule Win32_Dropper_Anti_Analysis : DROP { meta: author = "Vitali Kremez" date = "2015-12-15" description = "Dropper.Exe" hash0 = "cb905889c03593359262e25b80021dfd" sample_filetype = "exe" strings: $string0 = "_cexit" $string1 = "terminate@@YAXXZ" $string2 = " <requestedExecutionLevel level" $string3 = "\\inherited.txt" $string4 = "These are not the bytes you are looking for..." $string5 = "notepad " $string6 = ">J>O>p>u>" $string7 = "urn:schemas-microsoft-com:asm.v1" $string8 = "5'646A6" $string9 = "BINARY" wide $string10 = "<C<O<Z<n<u<" $string11 = "DDINGPADDINGXXPADDINGPADDINGXXPADDINGPADDINGXXPADDINGPADDI$ $string12 = "2D2T2Y2_2e2{2" $string13 = "5(5H5d5h5" $string14 = " <trustInfo xmlns" $string15 = " version" $string16 = "bjqN_e" condition: 5 of them and filesize<25KB }
0 Comments
Leave a Reply. |
AuthorVitali Kremez Archives
September 2016
Categories |
 RSS Feed
